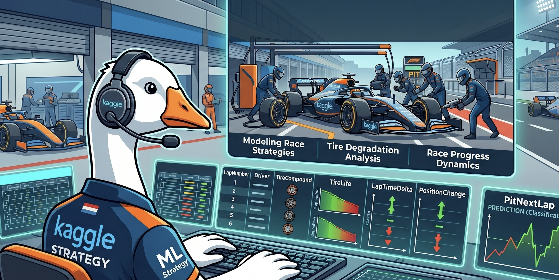
F1 Pit Stop Prediction
Predicting pit stop decisions from noisy race-state signals using ML
Overview
I’m a Ferrari fan. Have been for as long as I can remember. So when Kaggle dropped a competition about predicting F1 pit stops — Playground Series S6E5, 2,802 teams, 33,062 submissions — I didn’t need much convincing.
I went in thinking it would be a clean tabular ML problem. Train a model, optimize AUC, submit. Straightforward.
It wasn’t.
Currently ranked 2,193 / 33,062. But the number isn’t really the point anymore.
How the thinking shifted
My first framing was purely algorithmic:
- Clean dataset
- Train CatBoost
- Optimize AUC
That lasted about two days.
The shift happened when I stopped asking “how do I improve the model?” and started asking: “what does a pit stop actually depend on in a real race?”
That question changed everything. Because the answer isn’t in the data — it’s in understanding the sport. And once I started thinking like that, the data started making more sense.
What the data really was
The dataset looked like rows and columns. But when I actually sat with it, I started seeing something else.
Each row was a lap. Each lap was a moment in a race — tire wear accumulating, lap times shifting, positions changing. The dataset was a compressed representation of Formula 1 races unfolding over time.
That mental shift mattered. When you see it that way, features stop being abstract variables and start being observable race states. TyreLife isn’t just a number — it’s how many laps Leclerc has been on that set of mediums while Norris is closing on fresh softs. You know something is about to happen.
First model — and a question I couldn’t ignore
CatBoost baseline hit ~0.94 AUC almost immediately. Which was surprising.
The question that followed was more interesting than the result: “Why is this model already this good? What exactly did it learn?”
Most people would have submitted and moved on. I didn’t — because I wasn’t sure the model was doing what I thought it was doing.
The Race problem
When I checked feature importance on the early model, one thing stood out immediately.
Year — later appearing as Race in subsequent runs — was dominating importance at nearly 50%.
That’s when the uncomfortable question surfaced: is this model learning race logic, or is it learning dataset patterns?
A race identifier shouldn’t predict pit stops. Individual races have their own sequences and structures, but a model that relies on which race rather than what is happening in the race isn’t learning anything generalizable.
I ran the ablation: removed Year/Race from the feature set.
Performance dropped slightly. But the model became more stable, more honest, and more focused on variables that actually reflect race dynamics. That tradeoff was worth it.
The lesson: feature importance is not causality. A model can latch onto an artifact and score well — and you’d never know unless you went looking.
What the model actually learned
After ablation, here’s what the feature importance chart showed:
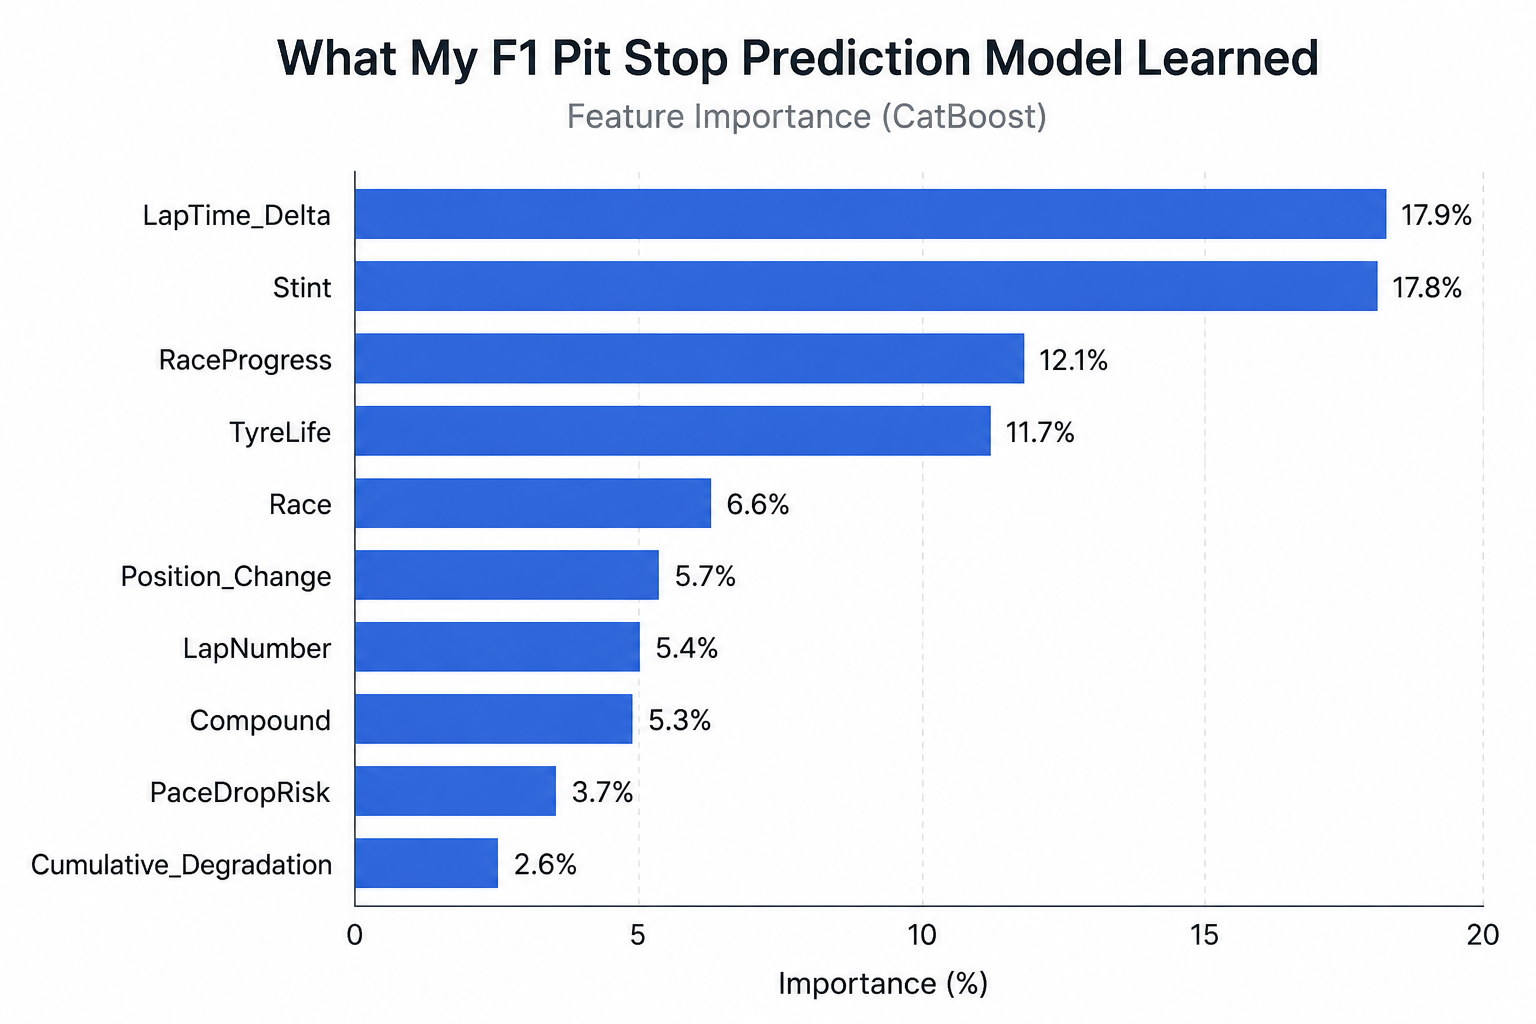
LapTime_Delta at 17.9% and Stint at 17.8% — neck and neck at the top. The model found the same two signals any F1 engineer would point to first. How fast are you going relative to your own pace? And how long have you been on this set of tires? Those two questions together tell most of the story.
RaceProgress (12.1%) and TyreLife (11.7%) fill in the race-stage context — where we are in the race, how much compound wear has accumulated.
Race at 6.6% is still there and still suspicious. It may be encoding race-level patterns that don’t generalize. Something to keep investigating.
Then the bottom two: PaceDropRisk (3.7%) and Cumulative_Degradation (2.6%) — the features I engineered by hand.
The model barely touched them.
Feature engineering as hypothesis testing
I designed those features with real race logic in mind:
- PaceDropRisk = LapTime_Delta × RaceProgress — the idea that tire degradation matters more in the final third of a race
- Cumulative_Degradation = rolling accumulation of pace loss over a stint — trying to capture the cliff before it happens
The reasoning was sound. The model disagreed.
And that’s the lesson: modern gradient boosting already learns nonlinear interactions internally. Feature engineering isn’t about adding more variables — it’s about adding genuinely new information. Recombinations of signals that are already in the dataset don’t teach the model anything it couldn’t find itself.
Every engineered feature is a hypothesis. The graph was the result.
Hyperparameter tuning and diminishing returns
I experimented with deeper trees, more iterations, lower learning rates. The training stability improved. The leaderboard didn’t move much.
Going from 0.93 to 0.94 AUC is relatively tractable. Going from 0.94 to 0.945 is a different problem entirely. The marginal gains at this performance level require either better features or fundamentally different modeling — not just more of the same.
What I actually learned
This project wasn’t really about predicting pit stops.
Feature engineering is hypothesis testing. Every feature is a claim about how the system works. The graph tells you which claims held up.
Strong models can hide weak reasoning. High AUC doesn’t mean the model understood the problem. It might just have found a shortcut.
Dataset artifacts can dominate. Year and Race identifiers showed how a model can latch onto unintended patterns and score well while learning nothing meaningful.
Interpretability matters as much as performance. A slightly lower AUC model that reflects real race dynamics is more valuable than a higher-scoring one built on artifacts.
Iteration is the real workflow. Build → test → analyze → question → refine. Not just model training.
Personal reflection
What kept me engaged wasn’t the leaderboard position. It was the gradual shift in the question I was asking.
I started with: “How do I get a higher AUC?”
I ended with: “Is this model learning something real, or is it fooling both of us?”
That shift is what made this feel like an actual engineering exercise rather than a competition.
There’s also something deeper here that connects to the work I do clinically. An optometrist reading OCT progression data and a strategist reading tire telemetry are solving structurally similar problems — both are looking at sequential signals accumulating over time, trying to decide when to act and on what evidence. The domain is different. The uncertainty is the same.
And if Ferrari’s pit wall ever needs an ML engineer who already knows when to box — I’m available.